

Most Shopify pricing decisions get judged by the wrong number.
Teams look at conversion rate, see a dip after a price increase, and assume the test failed. In reality, the higher price may still be producing more money from the same traffic.
That is why the winning price is not the one that converts the most.
It is the one that produces the strongest revenue per visitor.
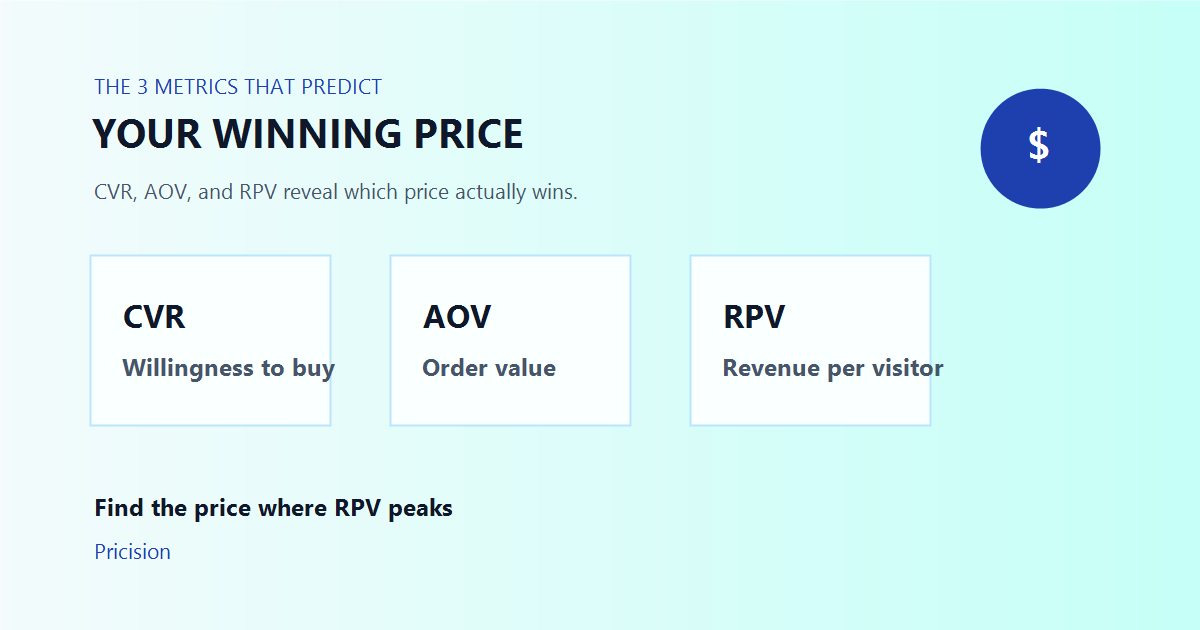
To find that price, you only need three metrics: CVR, AOV, and RPV.
The power trio behind profitable pricing
These three metrics tell you whether a price change is helping or hurting total performance:
| Metric | What it measures | Why it matters |
|---|---|---|
| CVR | How many visitors buy | Shows whether the market accepts the price |
| AOV | How much each customer spends | Shows the value of each completed order |
| RPV | How much revenue each visitor generates | Shows which price actually wins overall |
If you track all three together, your pricing decisions become much easier to trust.
Why revenue per visitor matters most
Many brands chase conversion rate because it feels intuitive.
If more visitors buy, the price must be better. Right?
Not always.
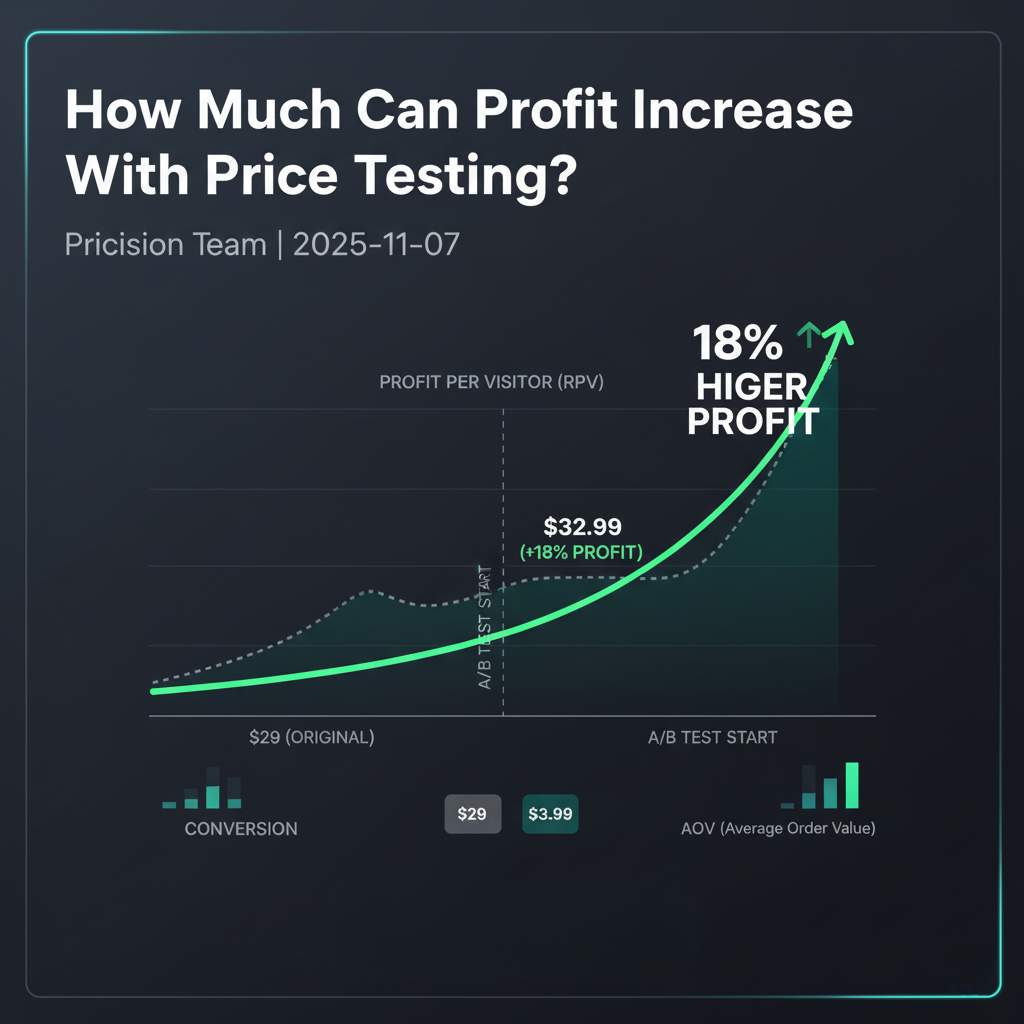
A lower price can raise conversion while reducing the value of every transaction. A higher price can lower conversion slightly while producing stronger economics from the same traffic.
That is why RPV is the truth-teller.
It combines the effects of conversion and order value into one number that makes price comparisons clearer.
A price does not win because it feels safer. It wins because it creates more value from every visitor.
Metric 1: CVR shows willingness to buy
Conversion rate tells you how many visitors are willing to purchase at a specific price point.
That makes it the clearest signal of immediate customer resistance or acceptance.
When price goes up, CVR often goes down. That is normal. The key question is whether the drop is large enough to cancel out the gain from a higher selling price.
Track CVR to answer questions like:
- Are customers still comfortable buying at this price?
- Does demand fall gradually or sharply?
- Which price point creates obvious resistance?
CVR is important, but it is only part of the story.
Metric 2: AOV shows the value of each purchase
Average order value tells you how much customers spend when they do convert.
In a simple single-product price test, AOV often moves directly with the tested price. But it still matters because it shows whether a slightly higher price is lifting order value enough to justify a modest conversion drop.
It also helps you spot how customers respond to pricing presentation.
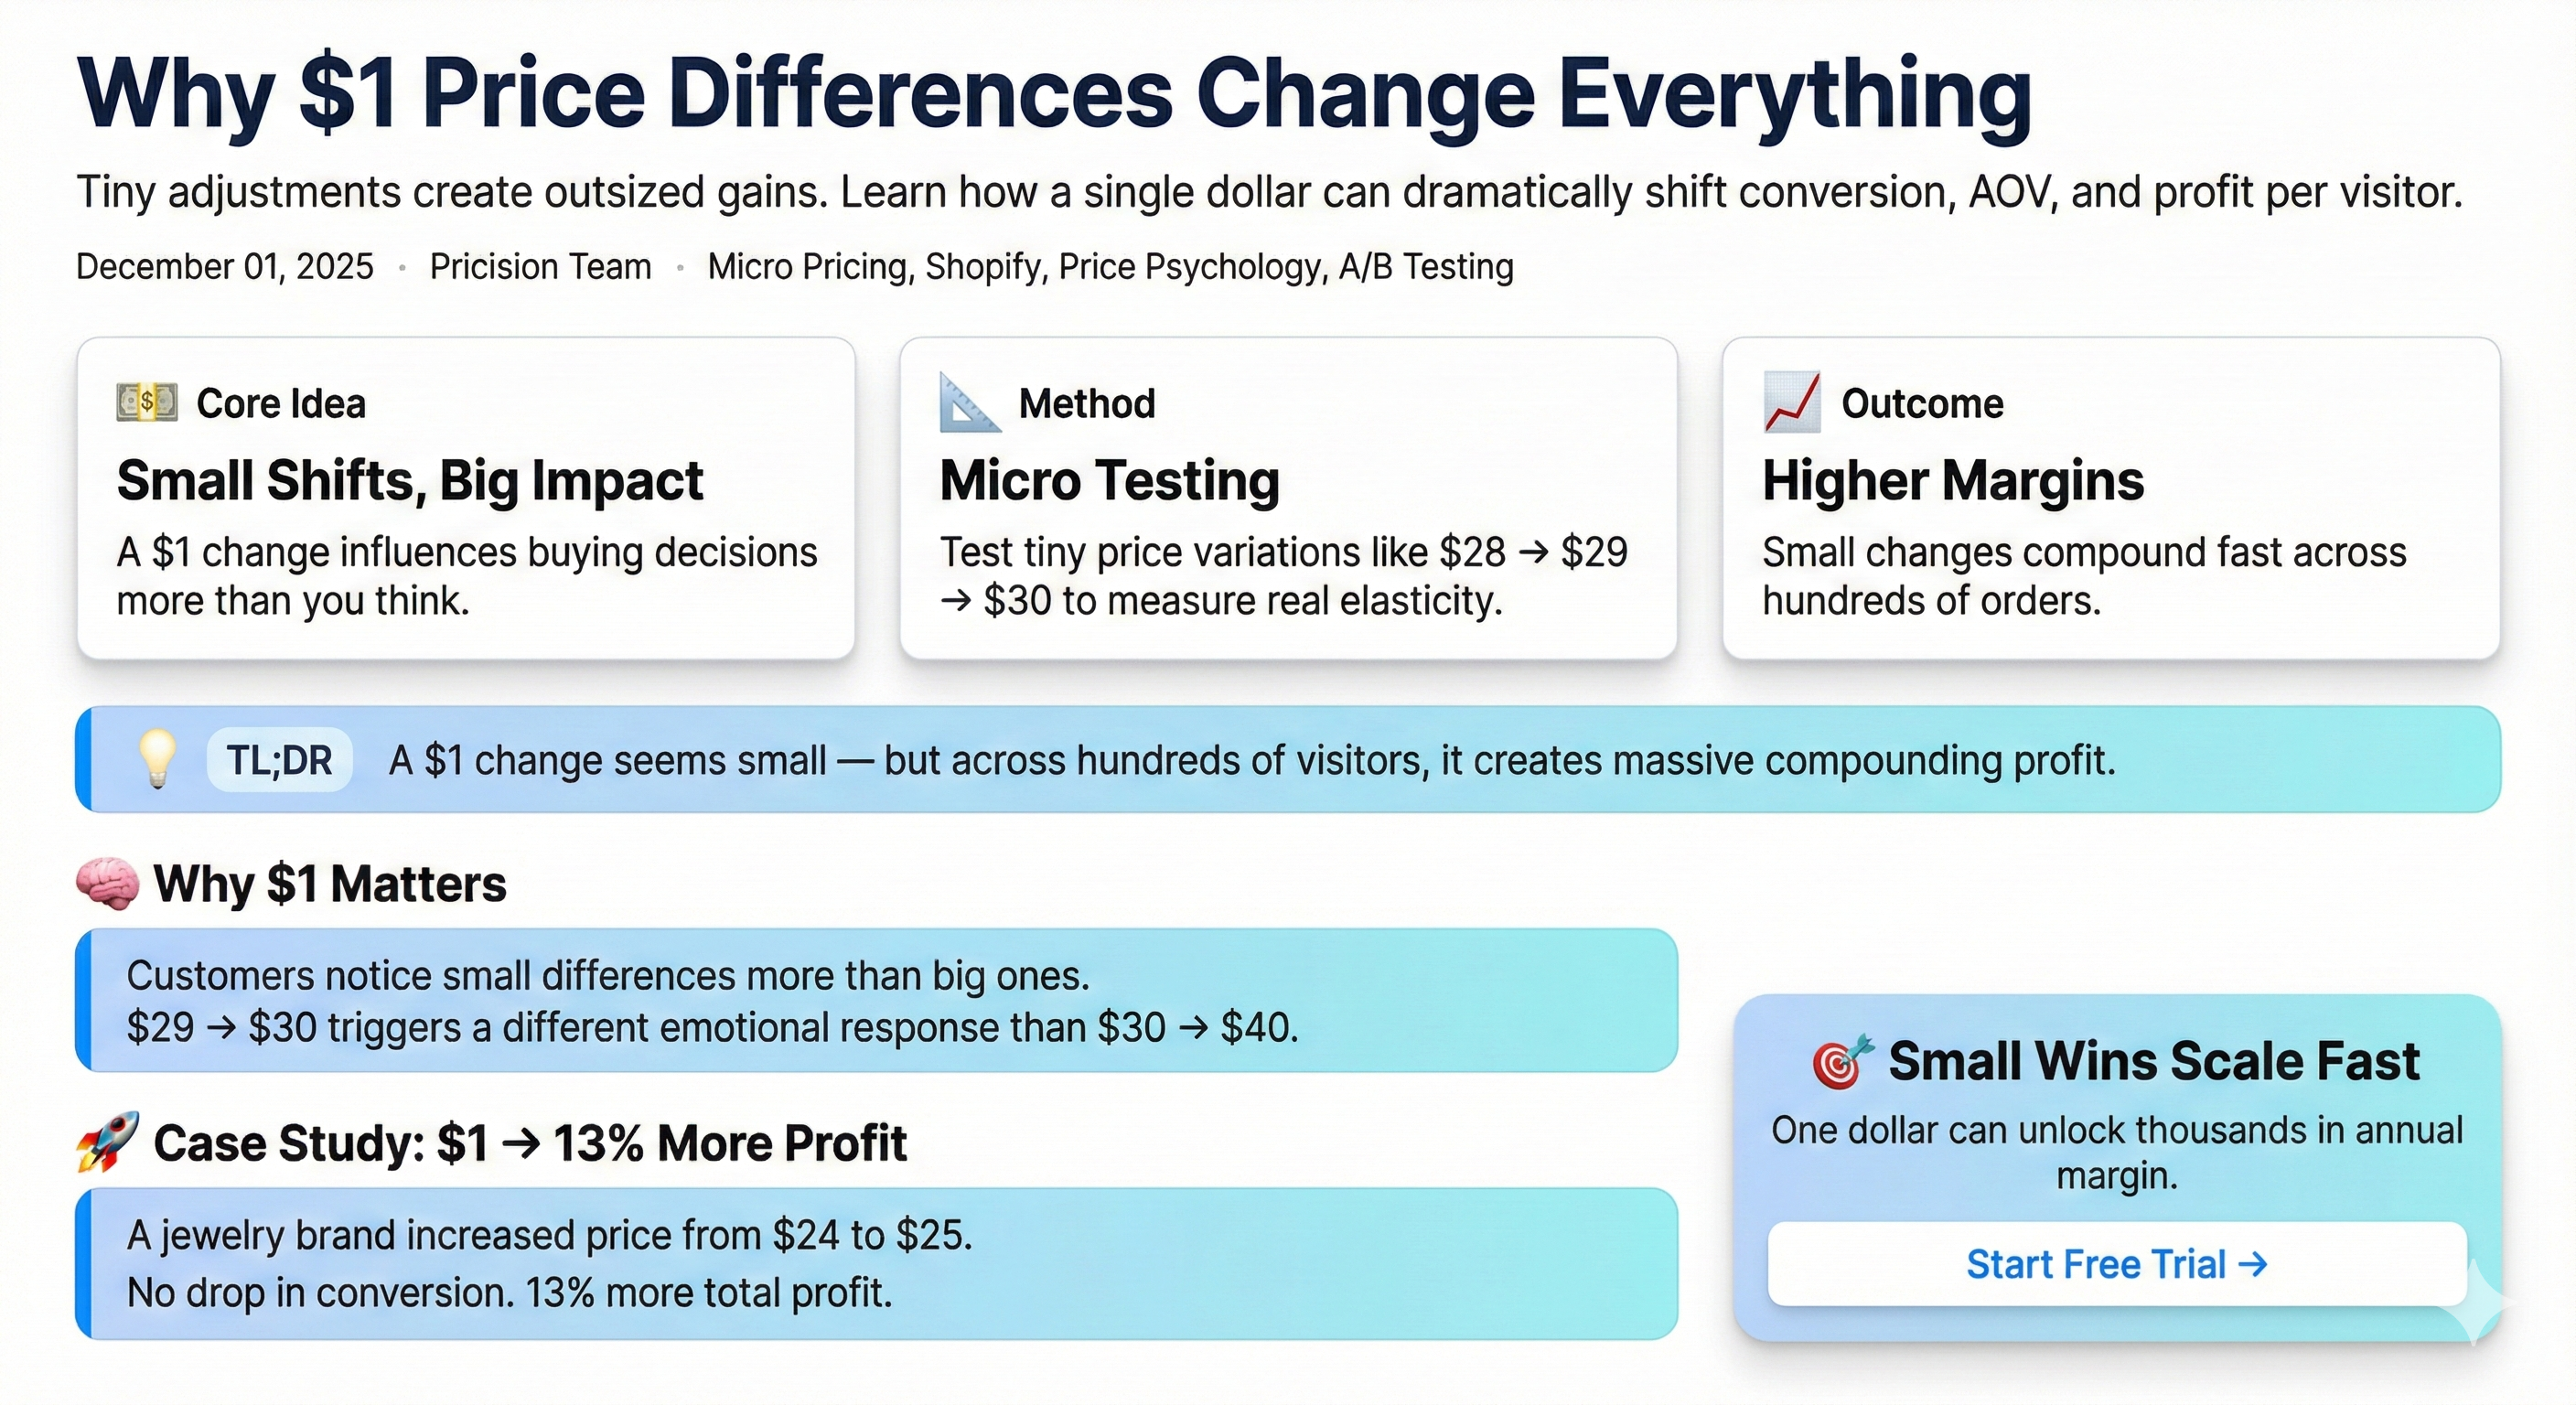
For example, small differences such as .95, .99, and .00 endings can influence how expensive or premium a product feels.
Use AOV to evaluate:
- Whether a higher price is increasing order value meaningfully
- Whether price endings change perceived value
- Whether the price lift is large enough to offset softer conversion
Metric 3: RPV reveals the real winner
Revenue per visitor is the metric that ties the decision together.
It answers a simple question:
How much revenue does each visitor generate at this price?
That makes it the most practical way to compare price points in a live experiment.
| Price | CVR | AOV | RPV | Interpretation |
|---|---|---|---|---|
| $45.00 | 4.8% | $45.00 | $2.16 | Strong conversion, lower value |
| $49.00 | 4.4% | $49.00 | $2.16 | Balanced performance |
| $52.00 | 3.7% | $52.00 | $1.92 | Value rises, demand drops too far |
Even when one price converts best and another produces the largest order value, RPV helps show which option actually creates the strongest outcome.
How the three metrics work together
The most useful way to read a pricing test is as a sequence:
- Start with CVR to see whether shoppers still accept the price.
- Check AOV to understand how much value each order creates.
- Use RPV as the decision metric to compare total outcome per visitor.
This prevents a common mistake: overreacting to a conversion drop without asking whether the economics improved.
In practice, the winning price is usually the one where RPV peaks, even if it is not the top performer on CVR or AOV alone.
A practical example: $45 vs $49 vs $52
A personal care brand tested three price points over seven days:
- $45.00
- $49.00
- $52.00
The result pattern looked familiar:
- $45 produced the highest conversion rate
- $52 produced the highest order value but a sharper conversion drop
- $49 kept conversion healthy while improving value per order
The winner was $49 because it delivered the strongest overall revenue per visitor.
That is the kind of outcome many stores miss when they focus on only one metric.
Why most stores use the wrong scoreboard
Pricing decisions go wrong when teams rely on incomplete data.
The most common mistakes are:
- Judging the result by conversion rate alone
- Ignoring revenue or profit per visitor
- Changing prices inconsistently instead of testing them systematically
- Treating the highest-priced option as the automatic winner
The fix is not complicated.
Use short, controlled A/B/n experiments and compare every variation through the same three-metric lens.
A simple testing workflow to use on Shopify
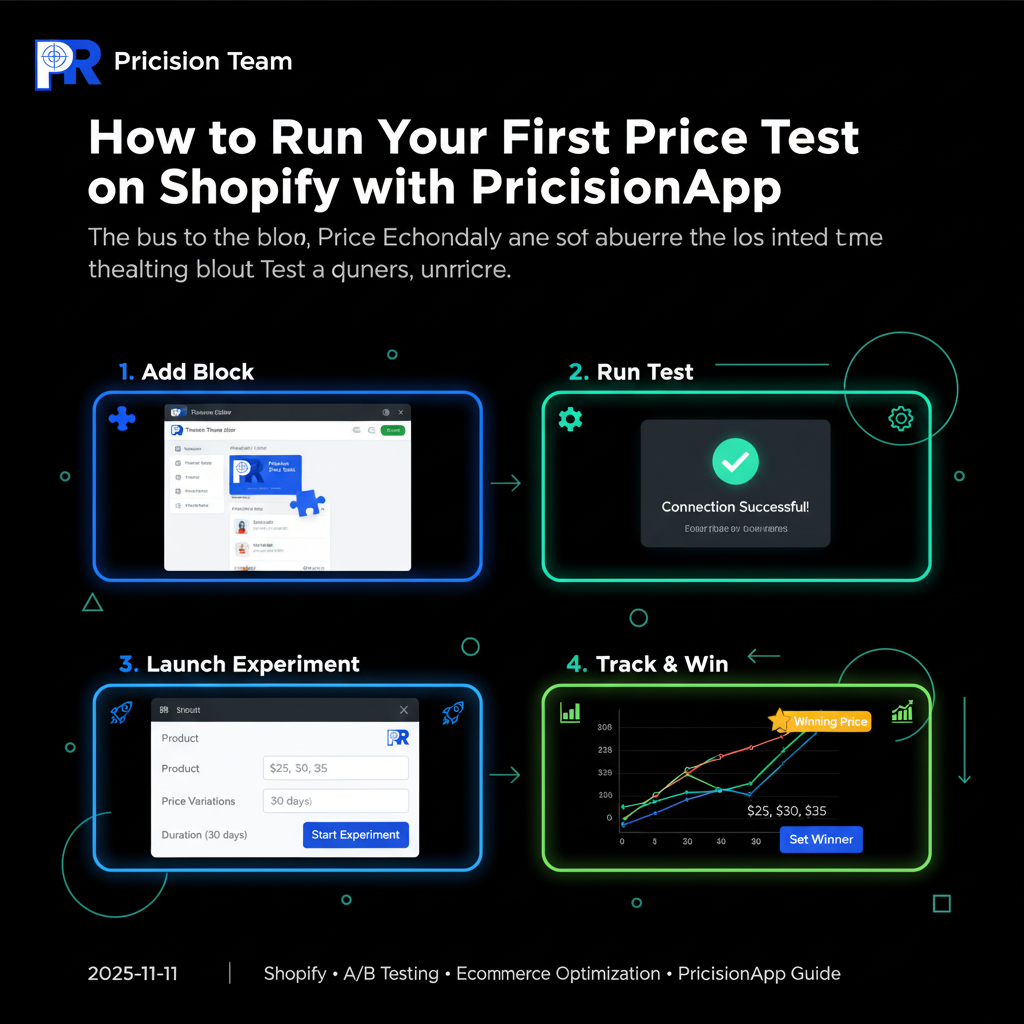
If you want a repeatable process, keep it simple:
- Choose one product with stable traffic.
- Test three to five realistic prices.
- Keep the page, traffic mix, and offer structure stable.
- Measure CVR, AOV, and RPV for each variation.
- Promote the price with the strongest overall result.
This makes the pricing decision less emotional and far more repeatable.
Final takeaway
Your best price is not the one that gets the most orders.
It is the one that creates the best outcome from every visitor who lands on the page.
If you test multiple prices and track CVR, AOV, and RPV together, your winning price becomes much easier to spot and much easier to defend.
Pricision
Stop guessing your next price
Use real customer behavior to discover the price that generates the strongest result for your Shopify store.
Start your free trial